scala-js-heatmap
Heatmap visualization using IndoorAtlas Data API and Scala.js

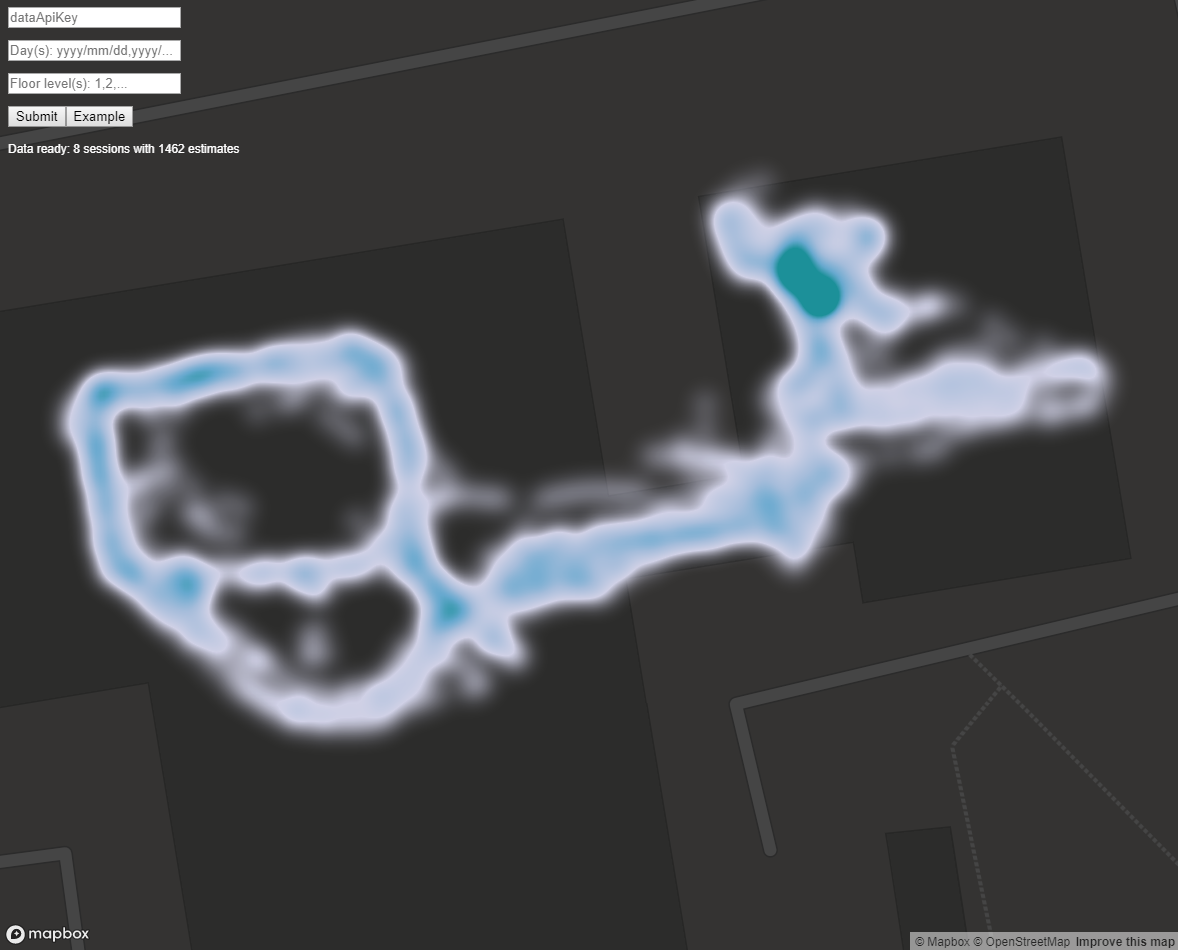
This project implements a simple web service that can be used to visualize IndoorAtlas session data for a given account, dates and floor levels. It demonstrates how
- IndoorAtlas Data API can be used to fetch the session data, based on Data API key and given dates
- The data can be used with heatmap visualization libraries, such as MapBox GL JS
Live demo here
- Visualise your own user data or use an example visualization here.
- In order to visualize your own user data, you will need an IndoorAtlas account with session data and a Data API key.
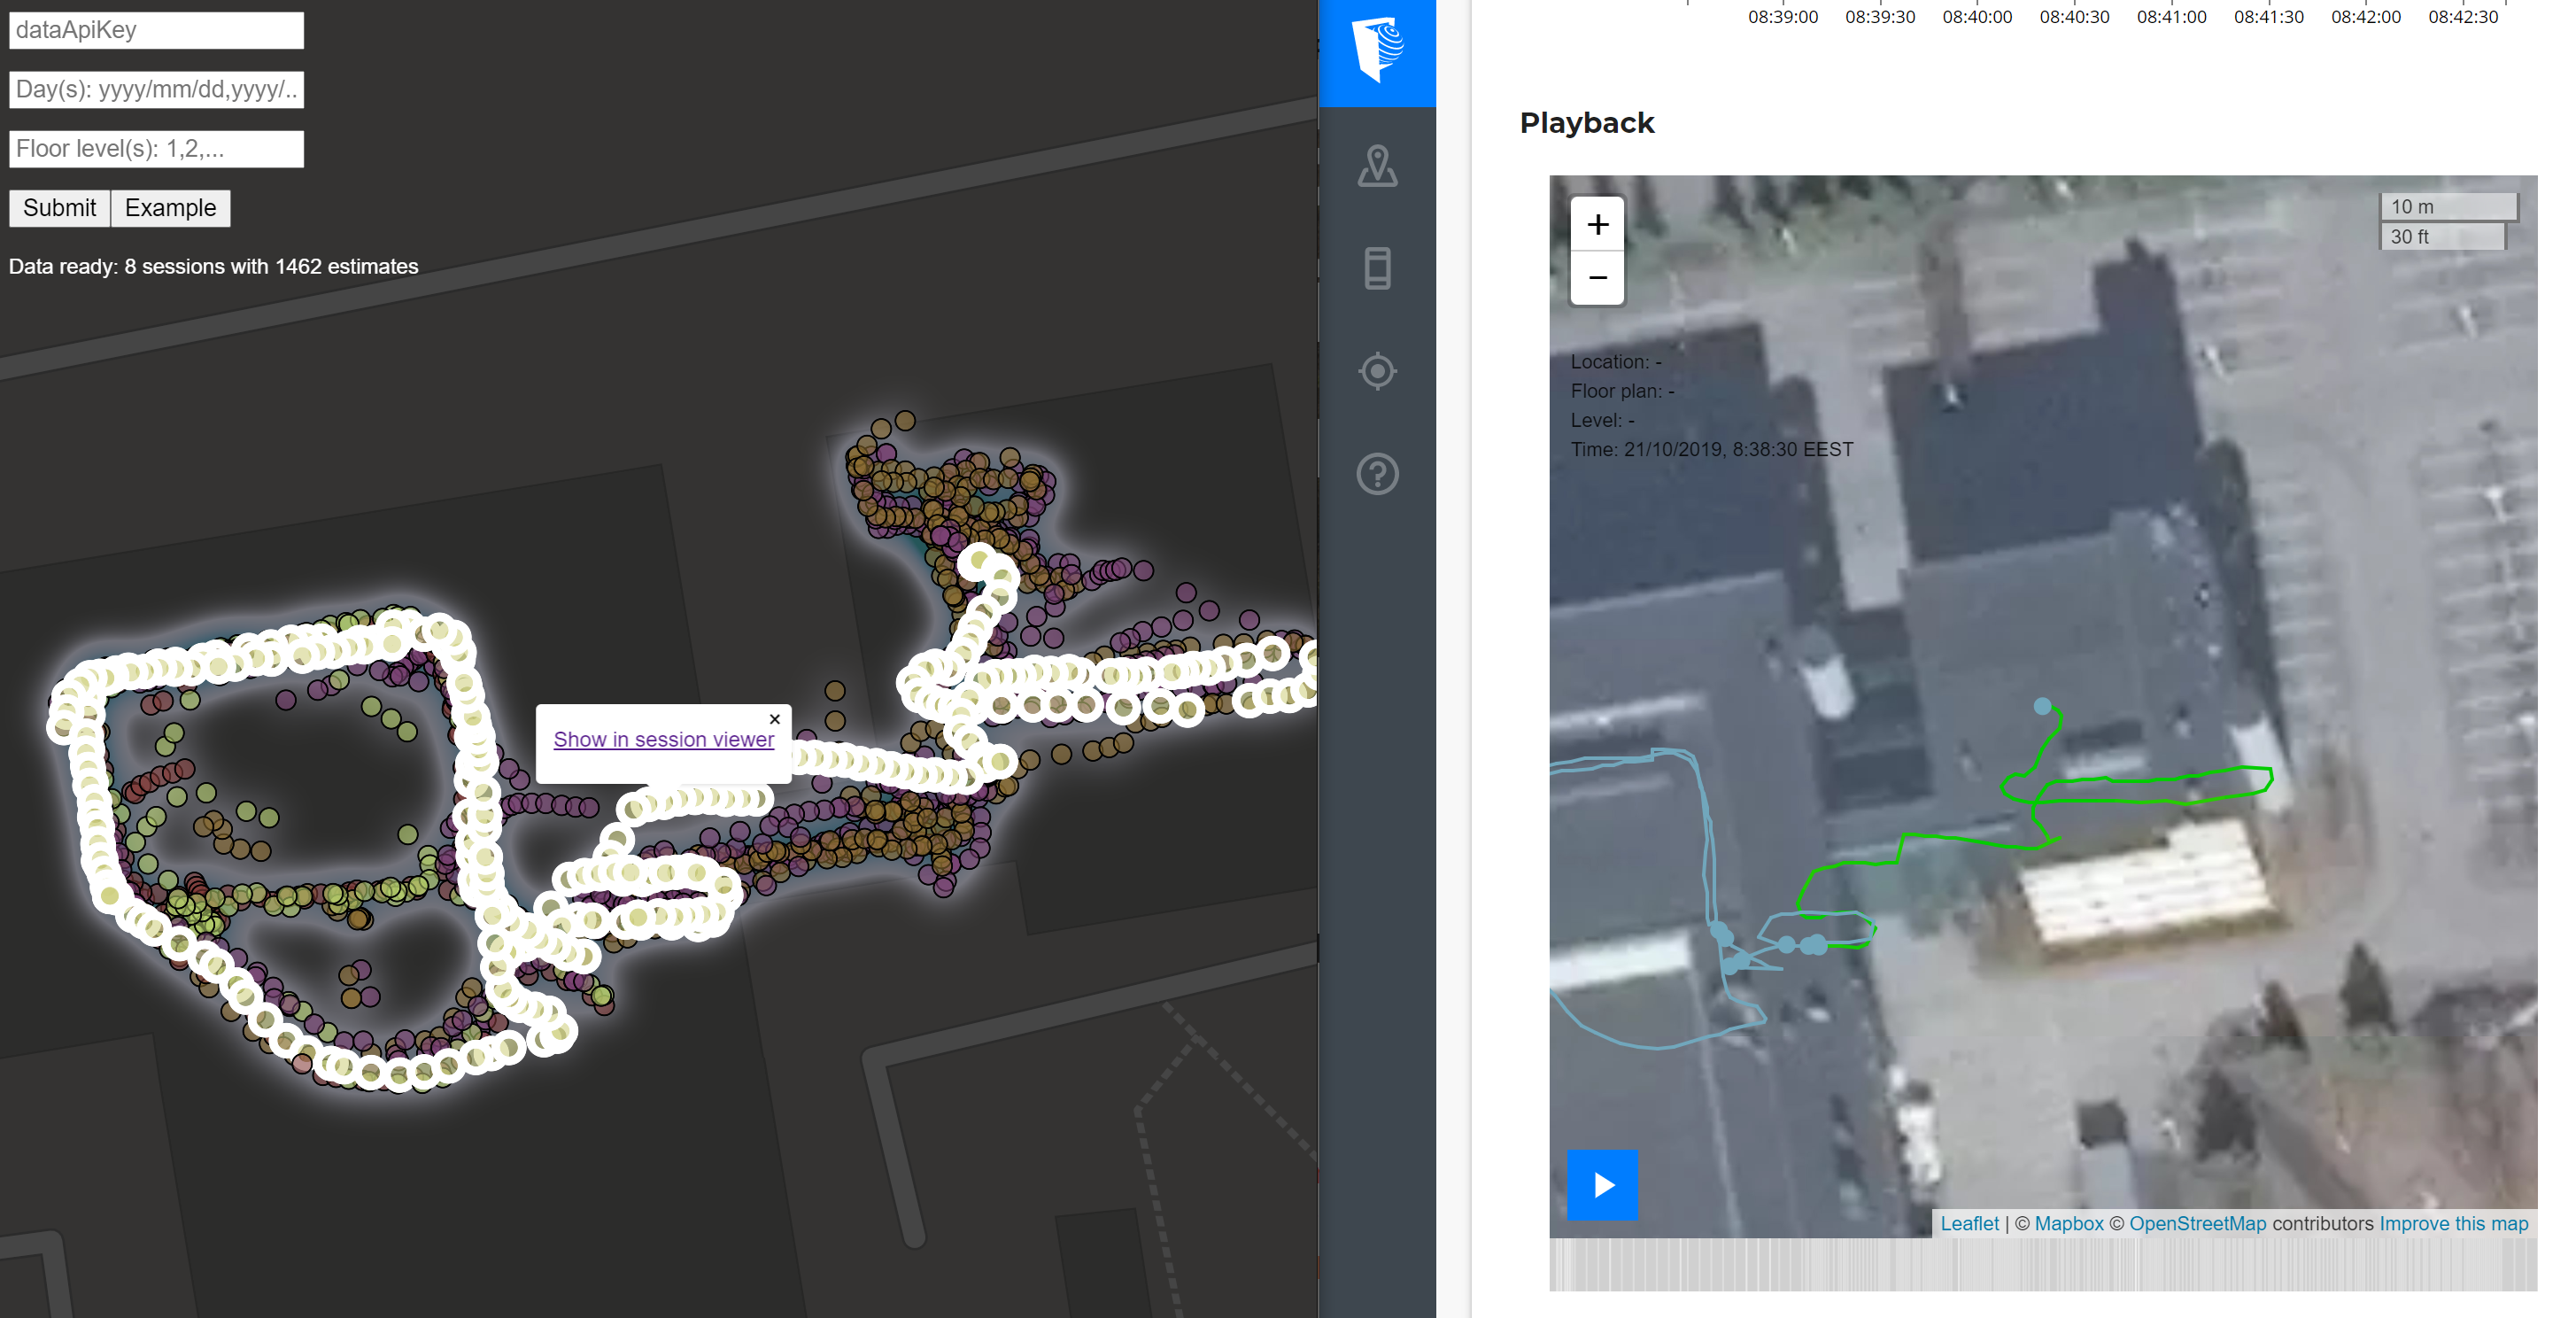
- When using your own Data API key and logged in to IndoorAtlas, paths can also be used as a link to view the session in the IndoorAtlas session viewer:

Commercial use
This repository is for demonstration only. Users wishing to use IndoorAtlas Data API for commercial purposes, contact sales@indooratlas.com.
Related content
- IndoorAtlas Data REST API Overview (with examples), and API Reference
- Instructions for how to create Data API keys
- MapBox GL JS API and Heatmap tutorial
- Scala.js home page and tutorial
Building and running locally
- Install sbt 1.3.0
- Run sbt from command line in the project root
- Should automatically resolve all dependencies
- Build using
sbt fastOptJSorfastOptJS(in sbt console)- For production, use
fullOptJSand changeresources/index.htmldependency accordingly
- For production, use
- Use
~fastOptJSfor automatic build with code changes (e.g. when using an IDE) and refresh the page when done
- Open
target/scala_2.12/classes/index.htmlin a browser- Fill the fields and submit
- Use Example button for fixed demo query config
Possible future improvements
- Make the project cross compile to JS and JVM
- command line + save to local json file for JVM
- src folders already reflect this